How many hours of sun does your garden get?
Seed packets ask for “full sun” or “partial shade”, but it is hard to judge by eye how long a bed is really in the sun. The shadow of a house or a tree moves through the day and changes with the season. Sunshade works it out from a 3D model of everything around your garden.
Open the growing-season sun map →Free, in your browser. Needs a device with WebGL.
How it works
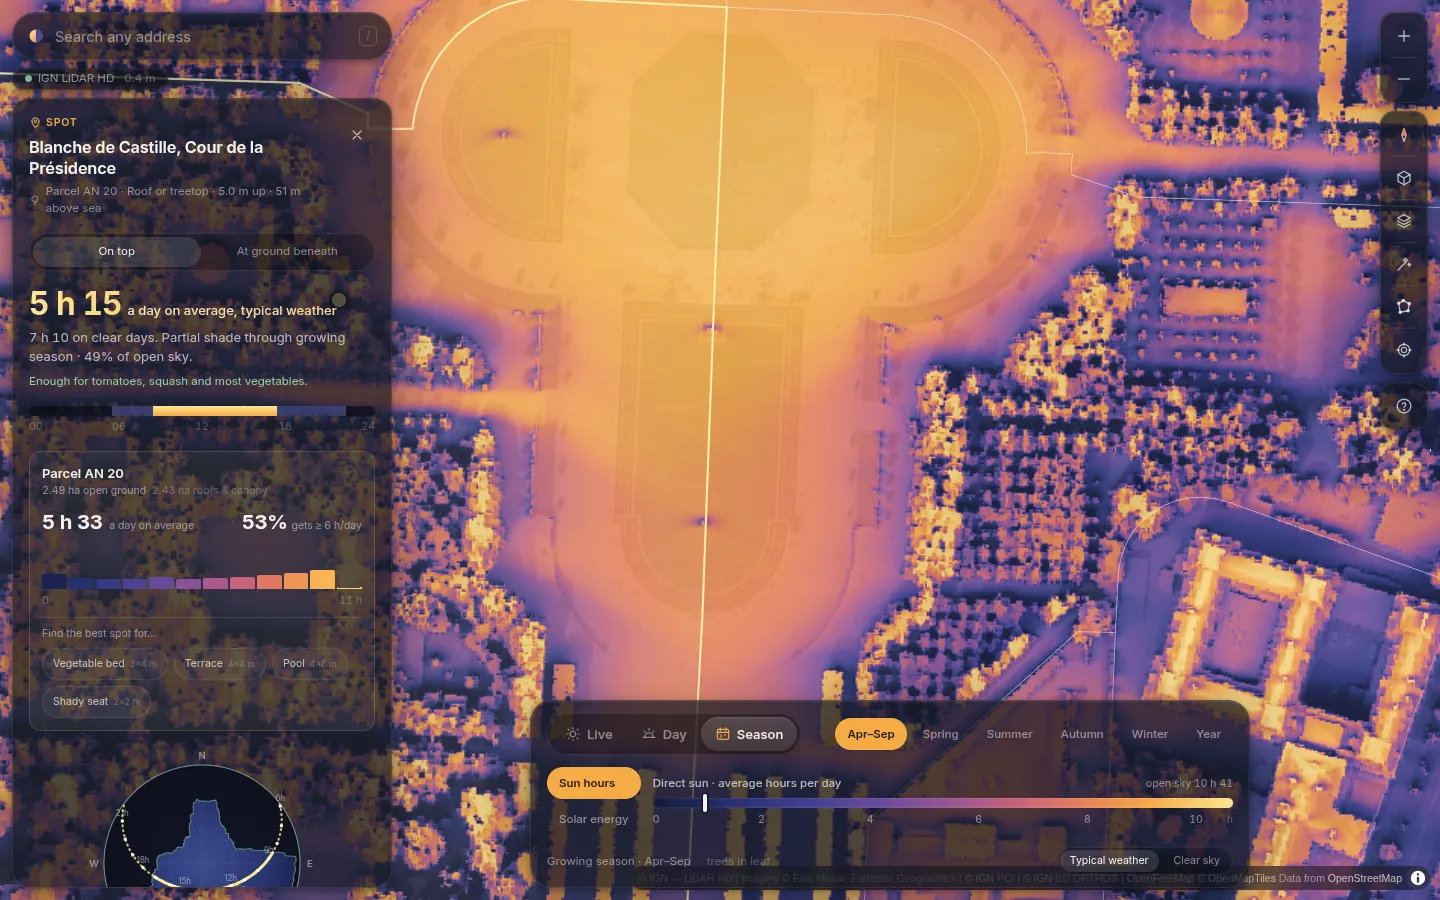
- Day shows the hours of direct sun for every 0.5 m cell on a date you choose. Season shows the average daily sun over the growing season (April to September), a single season, or the whole year.
- Pin a spot to see when it is in sun through the day, how its sun changes over the year, a fisheye view of what blocks its sky, and a plain-language verdict. Six hours or more is enough for tomatoes, squash and most vegetables; four to six suits leafy greens, herbs and roots; two to four suits shade-tolerant plants such as ferns, hostas and mint.
- Measure a whole plot. In France the cadastral parcel under the pin is outlined and analysed: open-ground area, average sun, the share getting at least six hours, and a histogram, with roofs and tree canopy counted separately. Anywhere, press A to draw your own area, such as a bed, a lawn or a terrace, and get the same statistics.
- Find the best spot outlines the sunniest place in the parcel or drawn area for a 3 × 4 m vegetable bed, a terrace or a pool, or the shadiest place for a seat. Only open ground counts.
Typical weather or clear sky
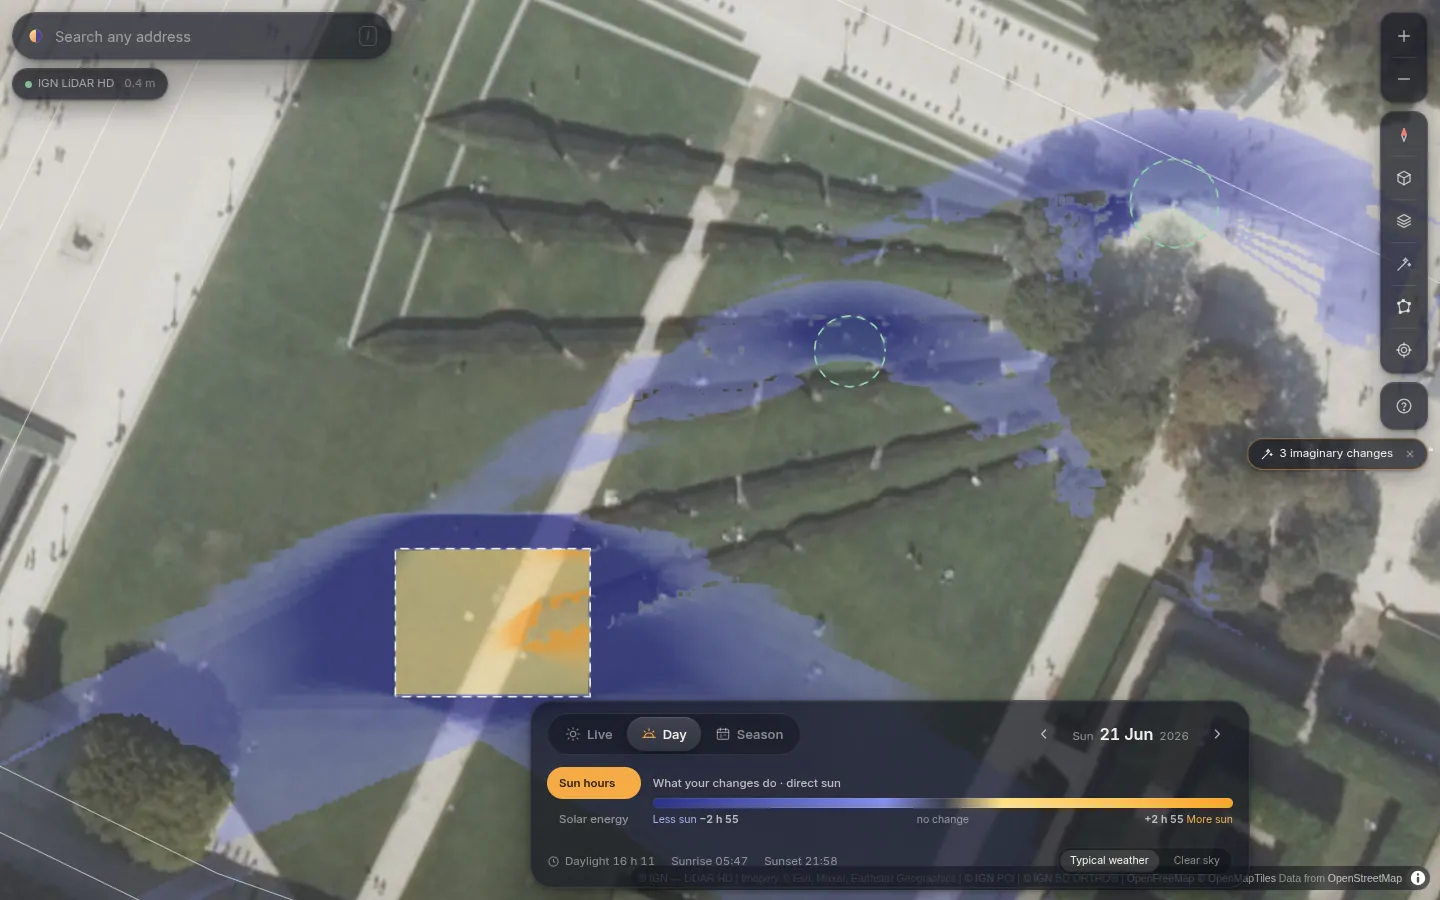
Day and season numbers are scaled by the place's monthly sunshine from ten years of climate data. Switch to Clear sky for the geometric maximum. The surveys are mostly taken with trees in leaf, so winter sun under deciduous trees is underestimated. To test a change before you make it, use What if… to plant or remove a tree and see the sun hours change.
Where the data comes from
Where countries publish national LiDAR surveys, Sunshade uses them directly: France (IGN LiDAR HD, with photogrammetric surfaces where LiDAR isn't available yet), the Netherlands, Flanders, Switzerland, England, surveyed parts of Scotland and Canada, Norway, New Zealand, North Rhine-Westphalia and Mecklenburg-Vorpommern. Everywhere else it builds an estimate from OpenStreetMap buildings, a global tree canopy-height map and terrain. The estimate shows big shadows (towers, streets, hills) well and small ones (a hedge, a shed) poorly; the status pill in the app always says which source you're looking at. All of it is open data, fetched live by your browser, and the shadows are computed on your own graphics card.
Open the growing-season sun map →