How much solar power could your roof produce?
Before asking for quotes it helps to know which parts of your roof are worth covering. Sunshade measures your roof from the elevation survey and traces the sun across it for a whole year, including the shade of the buildings and trees around it.
Open the yearly solar energy map →Free, in your browser. Needs a device with WebGL.
How it works
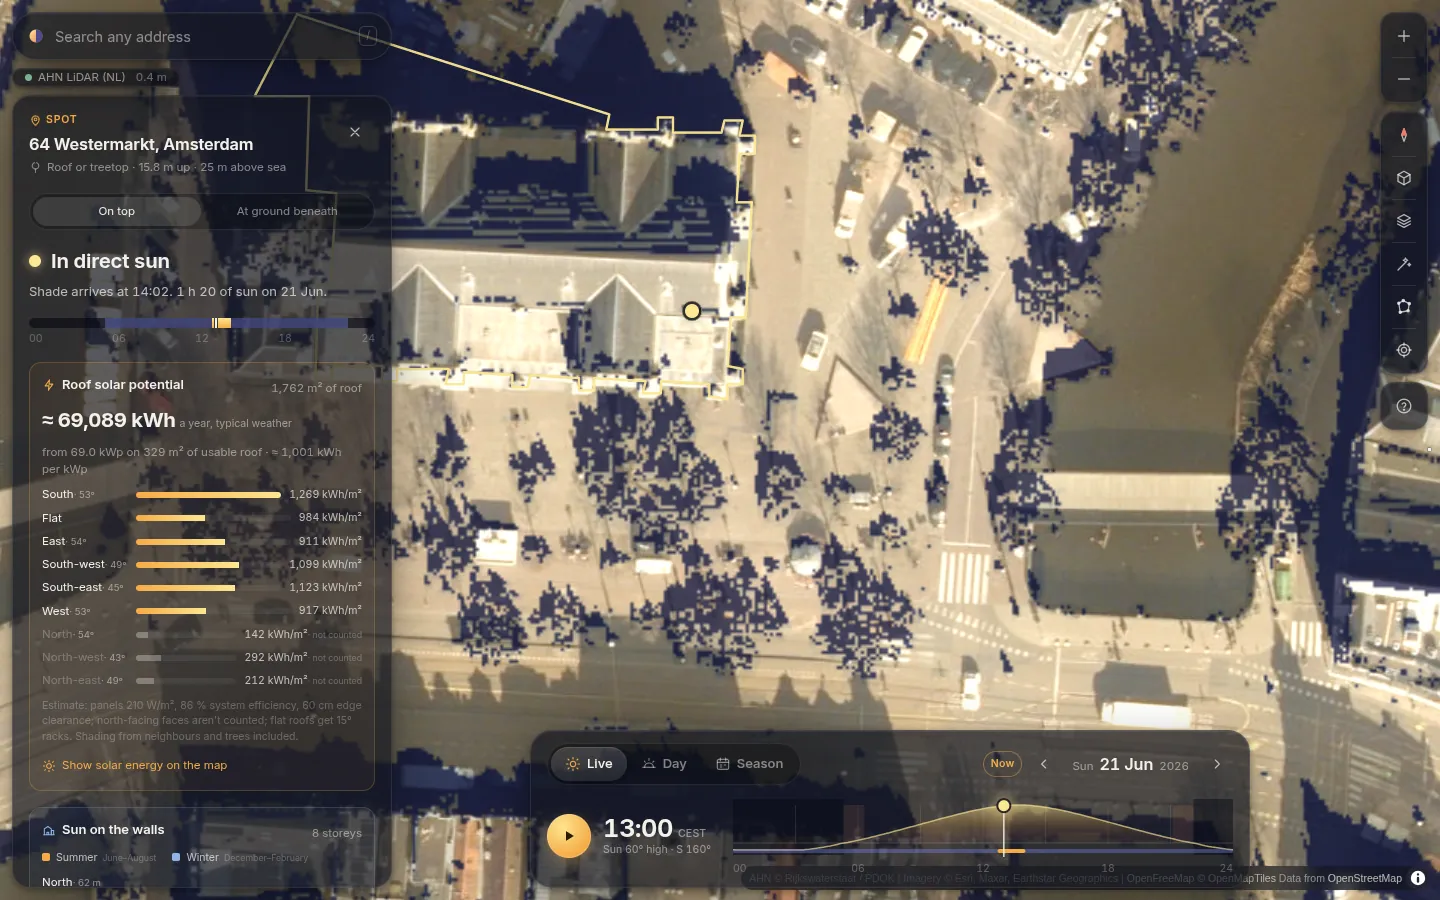
Search your address and pin your roof. The roof card shows:
- each roof face with its orientation, tilt and yearly sunlight in kWh per square metre, with neighbours' and trees' shade included;
- the usable area and the panel capacity it fits, in kWp;
- the yearly production in typical weather, scaled by the place's measured monthly sunshine.
Show solar energy on the map colours every roof and garden around you by its yearly solar energy, so you can compare faces, or your roof with your neighbours'.
How accurate is it?
For an unshaded roof, the estimate matches the EU's PVGIS reference to within a few per cent. Where it differs is shade: Sunshade traces the actual buildings and trees around your roof.
It is a planning estimate, not a bankable yield. It assumes 210 W/m² panels, 86 % system efficiency and 60 cm clearance from the roof edges; north-facing faces aren't counted, and flat roofs get panels on 15° racks. Chimneys, roof windows and local rules aren't known. Footprints come from the cadastre in France and from OpenStreetMap elsewhere, where terraced houses can merge into one block. Outside laser-surveyed areas the roof's shape is unknown and it is treated as flat, so the face-by-face figures are most useful where LiDAR is available.
Where the data comes from
Where countries publish national LiDAR surveys, Sunshade uses them directly: France (IGN LiDAR HD, with photogrammetric surfaces where LiDAR isn't available yet), the Netherlands, Flanders, Switzerland, England, surveyed parts of Scotland and Canada, Norway, New Zealand, North Rhine-Westphalia and Mecklenburg-Vorpommern. Everywhere else it builds an estimate from OpenStreetMap buildings, a global tree canopy-height map and terrain. The estimate shows big shadows (towers, streets, hills) well and small ones (a hedge, a shed) poorly; the status pill in the app always says which source you're looking at. All of it is open data, fetched live by your browser, and the shadows are computed on your own graphics card.
Open the yearly solar energy map →